
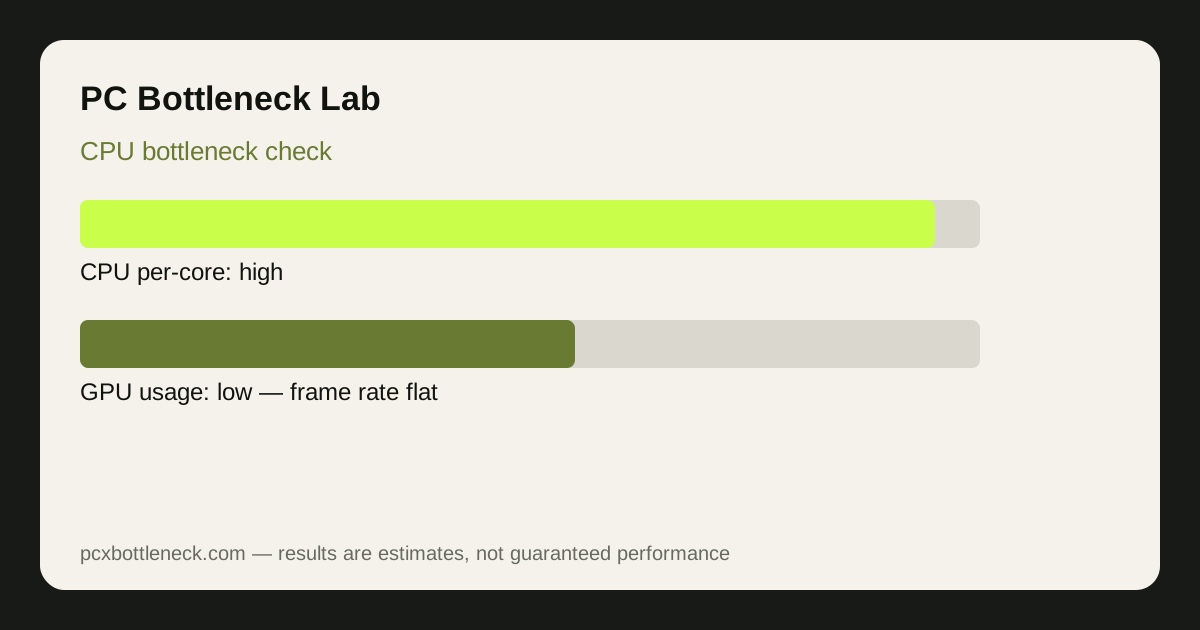
Repeat the same gameplay scene at normal and lower GPU settings. If GPU usage remains below its usual maximum and frame rate barely rises while one CPU core is saturated, the workload is probably CPU-limited.
What do you need before you start?
You need one game you actually play, MSI Afterburner with RivaTuner Statistics Server for the on-screen overlay, and PresentMon if you want frame-time data as well. Close browsers, launchers and recording software first. Background tasks can look exactly like a CPU limit, and they are the most common false positive in this test.
Pick a demanding scene, not a menu or a loading screen. Menus are often single-threaded and will mislead you. Play the same route or fight twice, once at your normal settings and once at a lower resolution, so you have something to compare.
What should you watch while you play?
Watch four numbers together. No single number proves a bottleneck on its own.
| What to watch | CPU bottleneck pattern | Healthy GPU-bound pattern |
|---|---|---|
| GPU usage | Often 50–80%, not near maximum | Often 90–100% |
| Per-core CPU usage | One or two cores near 100% | Cores have headroom |
| Frame rate | Stops improving when settings drop | Rises when settings drop |
| Frame time | Spikes when the CPU is busy | Steady, tracking the GPU |
Total CPU usage is misleading. A game that uses four cores heavily can show only 30–40% total usage on a 12-core CPU and still be CPU-limited. Per-core usage is the number that matters.
How do you confirm it in 10 minutes?
- Minutes 0–3: Play at your normal resolution and settings. Note GPU usage, the busiest CPU core, and average frame rate.
- Minutes 3–6: Drop the resolution to 1080p and lower demanding effects. If frame rate barely changes, the CPU is probably setting the pace.
- Minutes 6–10: Raise the resolution or effects back up. If frame rate falls as GPU load rises, the GPU is now the limit at that setting, which is normal.
If the result changes with resolution, you do not have one fixed bottleneck. You have a pairing that is CPU-limited at 1080p, balanced at 1440p, and GPU-limited at 4K. That is common, and it is why the PC bottleneck calculator shows ranges by resolution instead of one percentage.
What mistakes make the test wrong?
- Testing in a menu: menus do not load the GPU, so they always look CPU-limited.
- Ignoring temperatures: a CPU that throttles at high temperature looks like a slow CPU. Check boost clocks and temperatures first.
- Single-channel RAM: one RAM stick can hold back frame rates and look like a CPU limit. Check that RAM is in dual-channel mode.
- One game only: a strategy or simulation game can be CPU-limited while a story game on the same PC is GPU-limited. Test the games you actually play.
If you see CPU usage at 100% with low GPU usage , read that guide next. It separates a true CPU limit from thermal, RAM and background-task causes.
What do you do with the result?
If the test shows a repeatable CPU limit in the games you play most, compare the result with a modern gaming processor such as the Ryzen 7 9800X3D guide . This gives you a realistic reference point without assuming that every CPU upgrade is worthwhile.
Next, test the graphics card you actually own in the calculator. The RTX 5070 pairing guide shows why the recommended processor changes with resolution and refresh-rate target. If your limit only appears at 1080p but you play at 1440p, upgrading the CPU may produce less value than expected.
Limitation: monitoring shows what happened in your test, not a guaranteed frame rate for every game. Settings, drivers, RAM, cooling and the game engine all change the result. Treat the pattern as guidance, and repeat the test after any upgrade.
How this guide was reviewed
PC Bottleneck Lab reviewed this workflow against the behavior that a repeatable frame-time and resolution test is designed to reveal. Thresholds are intentionally described as patterns rather than universal cutoffs because game engines, frame caps, temperatures and monitoring tools can change the readings.
Frequently asked questions
How long does it take to check for a CPU bottleneck?
About 10 minutes is enough for a basic check: three minutes at normal settings, three minutes at lower resolution, and a few minutes to compare the two. A longer test in several games gives a more reliable answer, but the basic pattern usually appears quickly.
Do I need MSI Afterburner to check for a CPU bottleneck?
No, but it helps. Task Manager and the resolution test can point to a CPU limit, while Afterburner shows per-core usage and frame times, which are the numbers that separate a true CPU limit from a total-usage illusion on a many-core CPU.
What GPU usage points to a CPU bottleneck?
GPU usage well below maximum, often 50 to 80 percent, while one or two CPU cores are near 100 percent and frame rate does not rise when settings drop. One number alone does not prove it; the combination of low GPU usage, a busy CPU core and flat frame rate does.
Can a CPU bottleneck happen in only one game?
Yes. Strategy, simulation and esports games load the CPU very differently from story-driven AAA games. A pairing can be CPU-limited in one title and GPU-limited in another, so test the games you actually play most.
Should I upgrade my CPU if the limit only appears at 1080p?
Not necessarily. If you play at 1440p or 4K and the limit disappears there, a GPU upgrade may help more. Upgrade the part that limits the resolution and games you use, and confirm the choice in the calculator first.