
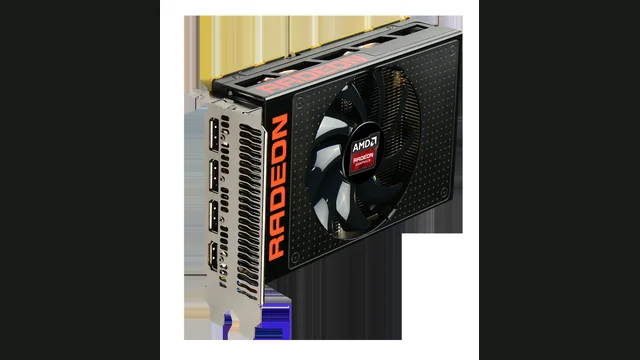
Radeon R9 Nano overview
Radeon R9 Nano is a GCN 3-based desktop graphics card with 4,096 shader cores and 4 GB of HBM memory. Its estimated gaming pace makes Entry-level 1080p its most sensible target.
CPU choice matters most at 1080p. At higher resolutions, the graphics workload increasingly becomes the system pace-setter.
PC bottleneck calculator takeaway: Use the pairing table as a starting point, then test your exact CPU, GPU and resolution in our calculator.
Updated November 10, 2026Reviewed by the PC Bottleneck Lab editorial teamModel scope: desktop gaming
Specifications and launch price
Launch pricing is historical reference data, not a live store quote. Used-market and regional prices can differ substantially.
Radeon R9 Nano resolution performance and graphics bottleneck analysis
The Radeon R9 Nano combines the GCN 3 architecture with 4 GB of HBM memory. Its estimated performance profile is best aligned with lighter 1080p workloads and reduced settings. This conclusion comes from its resolution scaling rather than the model name alone. Real results still vary with the game engine, visual preset, drivers, cooling, ray tracing and upscaling mode.
A graphics bottleneck is normal when the card remains near full utilisation while the processor has headroom. It becomes an upgrade concern only when delivered frame rates miss the user's target. The estimates below describe native raster planning pace, so features that reconstruct or generate frames should be evaluated separately.
Resolution bars use the same normalized data as the calculator. They exclude a specific game's ray-tracing load, frame generation and custom overclocking.
VRAM capacity, memory bus and texture settings
The limited capacity requires careful texture settings and can create asset-swapping stutter before raw shader performance is exhausted. The 4096-bit interface and approximately 512 GB/s bandwidth help define how quickly assets move through the graphics pipeline. When VRAM fills, users may see texture swapping or uneven frame times. Lowering textures is usually a better first response than reducing every visual setting.
Processor pairing and high-refresh gaming
CPU choice matters most at 1080p because the graphics card completes frames more quickly there. At 1440p and 4K, pixel work increases and the GPU usually sets the pace. A flagship processor may improve competitive minimums, but it rarely transforms a build that already remains GPU-bound in demanding games.
Power, cooling and PCI Express considerations
Its moderate board power needs sensible airflow and a quality power supply without demanding an oversized unit. The listed interface is PCIe 3.0. Users upgrading an older platform should check slot generation, physical clearance and power connectors. A bandwidth limitation is most relevant when the card uses fewer lanes or when memory pressure causes frequent transfers across the bus.
When a graphics card upgrade is justified
Consider a faster GPU when utilisation stays near maximum and frame rates remain below the display target after sensible settings changes. Before buying, test temperatures, driver behaviour and frame-time consistency. Upscaling can extend useful life, while native 4K or heavy ray tracing may justify moving to a stronger performance class sooner.
How to confirm the limiting component
Record a repeatable gameplay scene with uncapped frame rates, then monitor GPU utilisation, temperatures and frame-time consistency. Repeat the run after lowering resolution or render scale without changing CPU-heavy settings. A meaningful frame-rate gain confirms that graphics work was limiting performance. If utilisation falls but frame rate barely changes, inspect CPU threads, memory configuration and background software. Test several games before purchasing an upgrade because competitive, simulation and cinematic engines place different demands on the same card. Measured behaviour should guide the final decision, while the calculator provides the starting hypothesis.
Does the Radeon R9 Nano bottleneck at 1080p, 1440p or 4K?
Highest CPU sensitivity and the best place to detect a processor ceiling.
More GPU work per frame reduces CPU pressure and improves pairing flexibility.
Usually GPU-limited; tune image quality or use upscaling when needed.
Best CPUs for the Radeon R9 Nano
Hold the Radeon R9 Nano back at 1080p
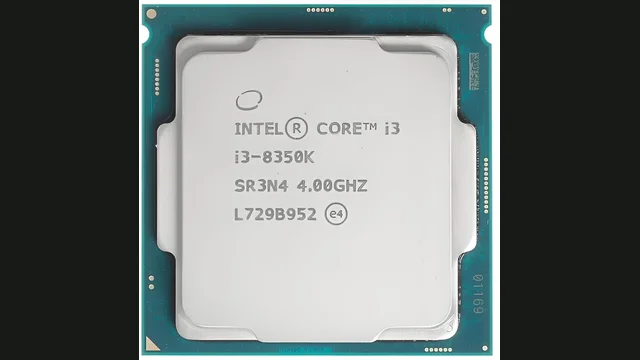
Intel Core i3-8350K
Holds the Radeon R9 Nano back at 1080p, about 3.9% CPU-limited. CPU pace ~56 FPS.
View CPU guide →Feed the Radeon R9 Nano fully
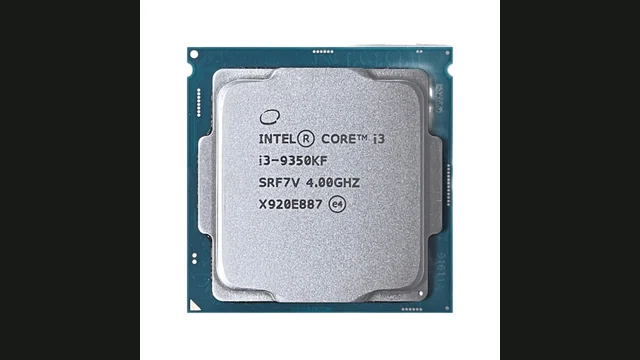
Intel Core i3-9350KF
Feeds the Radeon R9 Nano fully, no CPU limit at 1080p. CPU pace ~63 FPS.
View CPU guide →Resolution-aware estimates from the PC Bottleneck Lab model.
Estimates describe representative gaming pace. Game engine, settings, memory, thermals and background tasks can change real results.
How to tell if your CPU is bottlenecking the Radeon R9 Nano
Signs the CPU is limiting
- GPU usage remains below maximum during uncapped gameplay.
- Lower settings barely improve FPS.
- Frame-time spikes appear in busy scenes.
How to fix a CPU bottleneck on the Radeon R9 Nano
What to try first
- Check temperatures, memory configuration and background tasks.
- Test a higher resolution or more GPU-heavy settings.
- Upgrade only after monitoring confirms a repeatable CPU ceiling.
Similar GPUs to compare
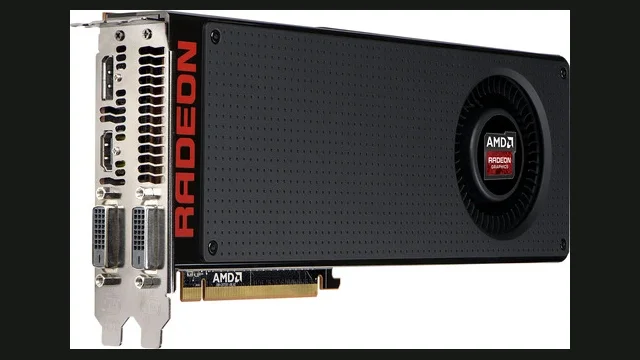
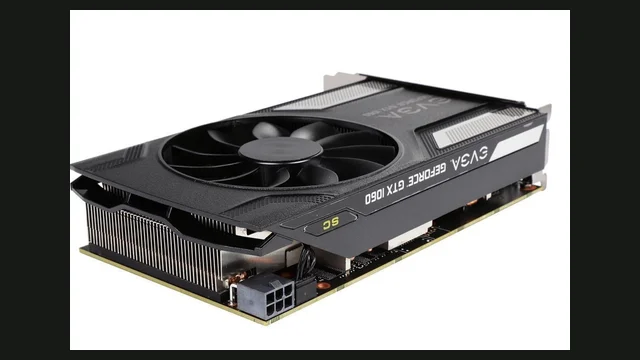
Radeon R9 Nano at a glance: CPU needs and alternatives
In the PC Bottleneck Lab model, the Radeon R9 Nano ranks #93 of 130 graphics cards covered here, at about 42 FPS at 1080p, 29 at 1440p and 18 at 4K, which puts it in the lower third of the set. If prices are close, the GeForce GTX 1070 is about 10% faster with 8 GB and the Radeon RX 5500 is about 10% slower with 4 GB.
To stay clear of a CPU limit the processor has to supply about 42 FPS at 1080p, 29 at 1440p and 18 at 4K. The slowest CPU we cover that manages 1080p is the Intel Core i3-9350KF; at 1440p it is even the slowest CPU we cover, the Intel Core i3-8350K. None of the 140 CPUs we cover show a CPU limit of 10% or more with it at 1080p.
Its 4 GB of memory on a 4096-bit bus is tight for current textures, so keep settings low.
Sources and limits
Specifications come from the PC Bottleneck Lab component database (database.json, updated 2 November 2026). Pairing percentages and FPS paces come from the PC Bottleneck Lab calculator model (calculator.js), which compares the processor's gaming pace with the graphics card's pace at each resolution. Model data current as of 10 November 2026.
Launch MSRP is the historical launch price from the PC Bottleneck Lab launch-price data; current store prices differ. Launch prices are historical reference data, not current store prices.
These are planning estimates, not measured benchmarks. Frame rates vary by game, settings, drivers and cooling, and the model does not measure your system directly. Confirm any upgrade decision with GPU utilisation and frame times in your own games.
Radeon R9 Nano FAQs
What CPU is enough for Radeon R9 Nano?+
To stay clear of a CPU limit the processor has to supply about 42 FPS at 1080p, 29 at 1440p and 18 at 4K. The slowest CPU we cover that manages 1080p is the Intel Core i3-9350KF; at 1440p it is even the slowest CPU we cover, the Intel Core i3-8350K.
Is Radeon R9 Nano better for 1080p or 1440p?+
The model puts the Radeon R9 Nano at about 42 FPS at 1080p, 29 at 1440p and 18 at 4K, so it is clearly a 1080p card, and 1440p needs lower settings or upscaling.
How accurate is a PC bottleneck calculator?+
It is a planning estimate, not a universal benchmark. Confirm the result with GPU utilisation, frame times and game-specific testing.
Will Intel Core i3-8350K bottleneck the Radeon R9 Nano?+
In the PC Bottleneck Lab model, the Radeon R9 Nano with the Intel Core i3-8350K is about 3.9% CPU-limited at 1080p, balanced with no meaningful bottleneck at 1440p and GPU-limited by about 7.1% at 4K. Treat this as a planning estimate and confirm it with GPU utilisation and frame times in your own games.
Will Intel Core i3-9350KF bottleneck the Radeon R9 Nano?+
In the PC Bottleneck Lab model, the Radeon R9 Nano with the Intel Core i3-9350KF is balanced with no meaningful bottleneck at 1080p, balanced with no meaningful bottleneck at 1440p and GPU-limited by about 17.4% at 4K. Treat this as a planning estimate and confirm it with GPU utilisation and frame times in your own games.
Is 4 GB of VRAM enough for Radeon R9 Nano?+
4 GB is tight for current textures, so keep settings low for the Radeon R9 Nano. At 4K or with maximum textures, VRAM is more likely to limit it before raw GPU speed does.
Does Radeon R9 Nano need a specific PCI Express version?+
The Radeon R9 Nano uses PCIe 3.0. It also works in older slots. With only this much VRAM, an older slot can cost a little extra performance when textures spill into system memory.
When is a graphics card upgrade better than a CPU upgrade?+
No CPU we cover holds it back by 10% or more at 1080p, so a graphics upgrade is usually the right first move once the Radeon R9 Nano misses your target. If prices are close, the GeForce GTX 1070 is about 10% faster with 8 GB and the Radeon RX 5500 is about 10% slower with 4 GB.