
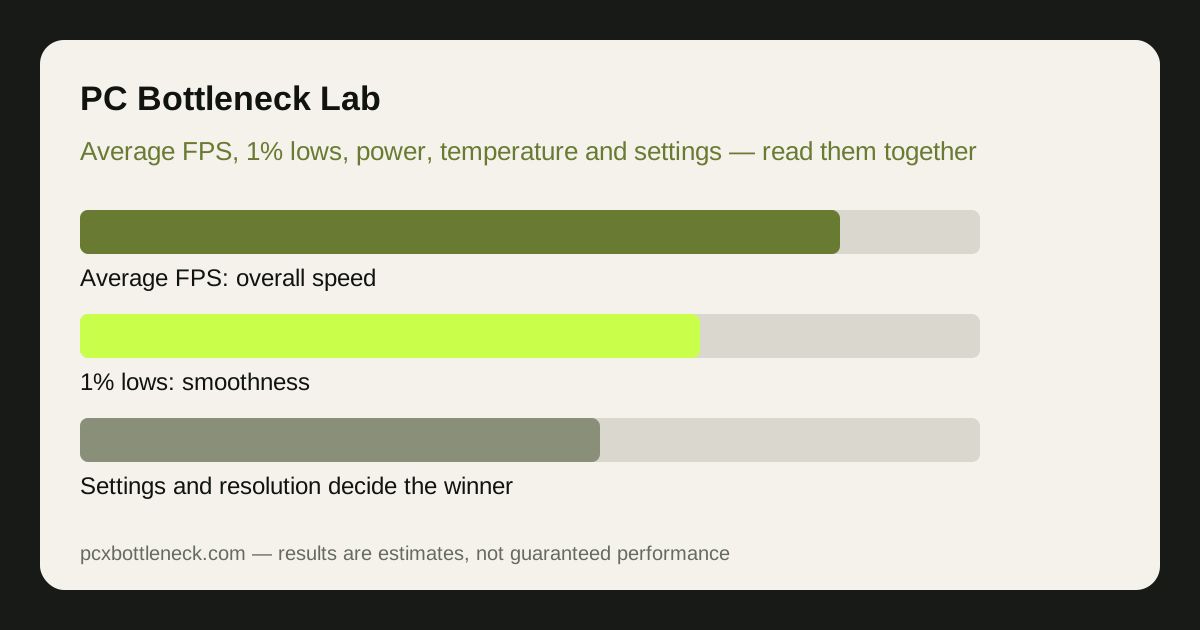
Average FPS: useful, but not the whole story
Average frame rate is the headline number because it is simple, and it is a fair starting point: it tells you the overall speed of a part in a given test. But as our stuttering guide explains, an average hides the slow frames, so a part with a higher average and worse 1% lows can feel worse in play than a part with a lower average and steadier delivery.
Also check how long the benchmark ran and what it tested. A 30-second fly-through of a quiet area is not the same as a ten-minute session of busy combat, and a benchmark that only tests one game is not a verdict on the part — it is a verdict on that game. Look for benchmarks that test several games, including at least one that resembles the games you actually play.
Finally, note the test system. A graphics card benchmarked with a flagship CPU will score higher than the same card in your PC if your CPU is weaker, and a CPU benchmarked with a flagship GPU will look better than it will with your mid-range card. The test system's other parts are part of the result, so a chart without a stated test system is a chart you cannot apply to your own build.
1% lows, frame time and power: the numbers charts hide
1% lows and frame time tell you whether the experience is smooth, and they are the numbers most worth checking after the average. A card that wins the average by a small margin but loses the 1% lows by a large one will stutter more in the moments that matter — turning, fighting, entering a new area. If a review omits 1% lows entirely, treat its average with extra caution.
Power draw and temperature are part of the result too, not footnotes. A card that wins a benchmark while drawing far more power and running hotter will cost more to run, need a stronger power supply and a better-cooled case, and may throttle in a long session where the benchmark's short run stayed cool. A win that depends on a short burst is not a win in a thirty-minute game.
Noise follows the same logic. A cooler that holds temperatures down by spinning fast is a different product from one that holds them down quietly, and benchmark charts never show noise. Written reviews that measure acoustics are the only honest source for that, and they matter more than a few frames per second for anyone who plays without headphones.
| Benchmark figure | What it hides | How to read it |
|---|---|---|
| Average FPS bar | Slow frames and stutter | Always pair it with the 1% low |
| 1% low | Rare single hitches | Compare in the same scene and settings |
| Peak power draw | Sustained power and heat over time | Check average power across a long run |
| Score at one resolution | Behaviour at your resolution | Only trust results at your monitor's resolution |
| Single-game result | Other engines and game types | Require several games, including yours |
Settings, resolution and method: the fine print that decides the winner
Settings decide benchmarks more than parts sometimes do. Ray tracing on or off, upscaling on or off, and the quality preset can each move a result by more than the gap between two competing cards — so a chart that mixes settings between cards is not a comparison at all. Check that every card in a chart was tested at the same resolution, the same preset and the same upscaling mode before you believe the ranking.
Resolution is the most commonly ignored condition. A card that wins at 4K can lose at 1080p, because the CPU's share of the work rises as resolution falls, and the chart's winner depends on which resolution the reviewer chose. Only results at your monitor's resolution apply to you; the rest are interesting but not decision-grade. Our guide to how resolution changes bottlenecks explains why the same pairing ranks differently at each resolution.
Method matters as well. A benchmark run once can be noise; a benchmark run three times and averaged is evidence. Driver versions, game patches and background software all shift results by a few percent, so a narrow win — a few percent — is not a real win at all. Treat small gaps as ties, and only large, repeated gaps across several games as a reason to choose one part over another.
Applying a benchmark to your own build
Translate, do not copy. Take the benchmark's test system, subtract the difference from your own CPU, GPU and RAM, and ask whether the ranking would survive that change. A CPU that wins when paired with a flagship GPU may not win with your mid-range card, because the GPU becomes the limit and the CPUs tie. The calculator at PC Bottleneck Calculator can help here: run your exact pairing at your resolution and see which part sets the pace before you let a chart decide.
Prefer benchmarks that publish their method: the games, the scenes, the settings, the driver version, the number of runs, and the 1% lows. A review that hides those is asking you to trust it, and trust without method is the same trap as the myths in the bottleneck myths guide — confident, shareable, and sometimes wrong.
Finally, remember that benchmarks measure the past: the driver and game versions of the test date. A card that lost narrowly at launch can win after driver improvements, and a game patch can change the ranking entirely. For a purchase you will live with for years, a recent re-test matters more than a launch-day chart.
Limitation: no benchmark can predict your exact experience, because your games, settings, background software and cooling all differ from the test bench. Use benchmarks to shortlist, then check the shortlist against your own resolution and games before buying.
Frequently asked questions
Why does one review rank a card first and another rank it third?
Because the test systems, games, settings, resolutions and driver versions differ. A card that wins at 4K with ray tracing on can lose at 1080p with ray tracing off, and a review that tests different games will rank differently. Only compare charts that used the same method.
Are 1% lows more important than average FPS?
Neither alone is enough. Average FPS tells you overall speed; 1% lows tell you whether the slowest frames ruin the feel. A good purchase needs both: a high average with poor lows stutters, and steady lows with a low average is simply slow. Check both before deciding.
Should I trust a benchmark that tests only one game?
Only for that game. One game tests one engine, one scene type and one workload, so it cannot rank parts in general. Look for several games, including at least one similar to the games you play, before treating a ranking as advice for your build.
What does a small benchmark gap actually mean?
Usually nothing. A gap of a few percent is within the noise from driver versions, game patches, background software and run-to-run variation. Treat small gaps as ties and only act on large, repeated gaps across several games.
Do benchmark results go out of date?
Yes. Driver updates, game patches and new upscaling versions can move results by a meaningful margin after launch. For a purchase you will keep for years, a recent re-test is worth more than a launch-day chart.