
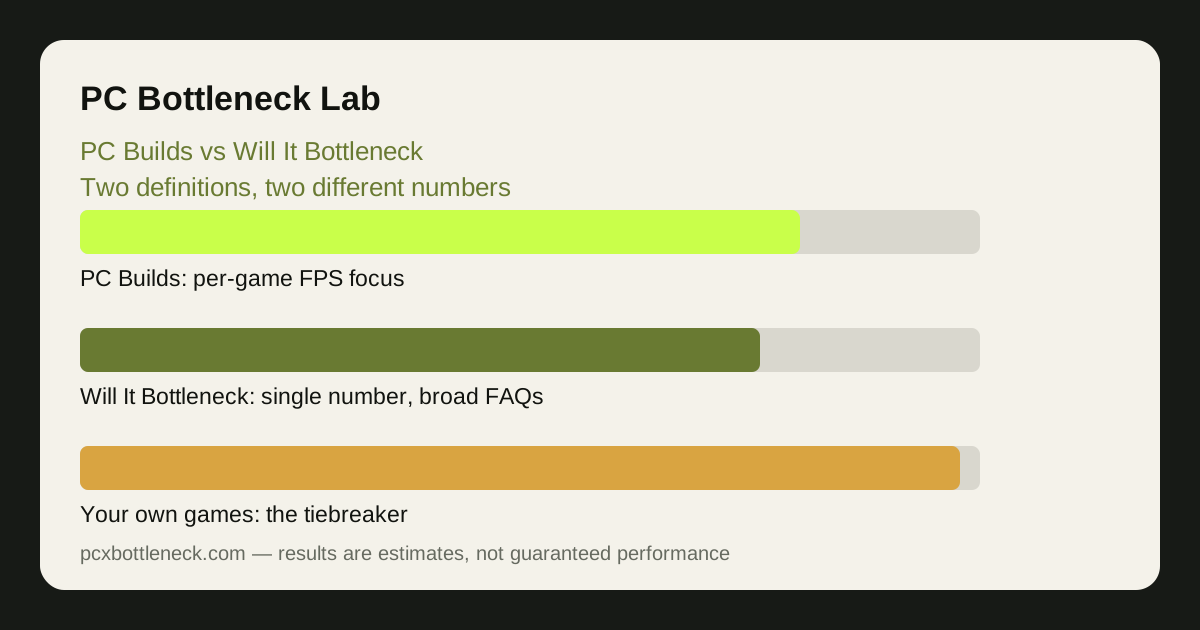
How each calculator defines its number
PC Builds presents its result as a bottleneck percentage alongside per-game FPS estimates, with pages for popular CPU and GPU combinations. The emphasis is on the pair as a gaming combination: what frame rates to expect in different games, and how the balance shifts with resolution. That structure makes it easy to compare two pairings in the same game — the comparison most builders actually need.
Will It Bottleneck presents its result as a single bottleneck percentage, supported by a large set of FAQ-style pages and links to FPS, power supply and best-pairing guides. The emphasis is breadth: many questions answered, many pairings covered, a simple headline number for each. That makes it quick to use, but the headline number carries a lot of weight alone, with less visible context about which game or settings produced it.
The two numbers are not directly comparable: different models, different game selections, different settings assumptions — so a pairing can score differently on each tool without either being wrong. Our guide to what a bottleneck percentage means explains why, and our calculator accuracy guide covers what any calculator can and cannot tell you.
Side by side: PC Builds vs Will It Bottleneck — where each tool is stronger
Neither tool is better in every way: each has strengths suiting a different question, and the honest comparison is about fit, not a winner.
| What you want | PC Builds | Will It Bottleneck | Our take |
|---|---|---|---|
| Per-game FPS expectations | FPS estimates per game for a pairing | FPS estimates with less per-game detail | PC Builds is more useful |
| A quick headline percentage | Percentage with the FPS context | Single percentage up front | Will It Bottleneck is faster |
| Comparing two pairings | Pair pages make comparison easy | Possible but less structured | PC Builds suits careful comparison |
| Answers to common questions | Covers the main questions | Very broad FAQ coverage | Will It Bottleneck covers more questions |
| Understanding the method | Method described with the results | Method less prominent | Prefer the tool that explains its number |
Notice what the table does not do: it does not declare a winner. The right tool depends on the question you are asking. A quick check before a purchase and a careful comparison of two builds are different jobs, and they suit different tools.
How to judge either calculator — and when to be sceptical
Judge a calculator by its method, not its number. A trustworthy tool tells you what games or data its estimate is based on, shows the result by resolution, and dates its data so you can tell whether it covers current hardware. A tool showing a single exact percentage with no method, no date and no mention of its limits asks you to take its number on trust — and a number you cannot inspect is one you should not base a purchase on.
Be sceptical of three things. First, exactness: a percentage with decimal places looks precise, but the model is not that precise, and the extra digits are decoration. Second, a result that never changes with resolution: the same bottleneck at 1080p and 4K means the tool is not modelling the game properly, because resolution genuinely changes the balance. Third, a tool that always recommends an upgrade: one that never says a pairing is fine is a sales tool, not a measurement tool.
The strongest check is your own PC: run the pairing through our calculator, which shows a separate balance estimate for each resolution, then confirm it with the 5-step self-test in your own games. If two independent tools and your own readings agree, the answer is solid. If they disagree, trust your games.
How to use both tools without being misled
Use them together, for different jobs: start with Will It Bottleneck for a fast headline check and its broad question coverage while learning the topic. Then use PC Builds for the per-game comparison once you have narrowed the choice to two pairings and want to see how they differ in the games you play. Then check the result against a third source — our calculator, or benchmarks for your specific games — before spending money.
Keep the inputs identical across tools: the same resolution, game type and settings idea. Comparing a 1080p result from one tool with a 4K result from another tells you nothing about the tools or the pairing. And remember that both tools model typical conditions, not your machine — your thermals, your RAM, your background programs and your driver version all shift the real result.
That is the honest answer to which calculator to trust: the one that explains its number, shows results for each resolution, and agrees with your own games. No single tool earns blind trust — the best decision comes from two tools and one home test, not one headline percentage.
Limitation: this comparison describes the two tools' public approaches — how they define and display their results — not a measured accuracy test of either one. We have not run a controlled benchmark comparison of the two tools, and we do not claim test results, scores or quotes from either site.
Frequently asked questions
Which is more accurate, PC Builds or Will It Bottleneck?
Neither can be declared the winner without a controlled test against measured benchmarks, and we have not run one. The useful difference is method: PC Builds leans on per-game FPS data, Will It Bottleneck on one percentage with broad FAQ coverage. Judge each by whether it explains its number and shows it by resolution.
Why do PC Builds and Will It Bottleneck give different percentages?
Because they define the number differently — different game selections, settings assumptions and models. A different definition gives a different number, so the two results are not comparable. Compare pairings within one tool, not numbers across tools.
Should I use more than one bottleneck calculator?
Yes. Two tools that agree give far more confidence than one alone, and when they disagree, the disagreement itself is informative — the result depends on assumptions. Confirm the answer with your own games either way.
Do these calculators account for my resolution?
Both consider resolution in some form, but how prominently varies. Always check the result at your own resolution: the balance of a pairing changes a great deal between 1080p and 4K, and a tool ignoring that is not modelling the game properly.
Can a bottleneck calculator replace benchmarks?
No. A calculator estimates the balance between two parts from a model; a benchmark measures real performance in a real game on real hardware. Use the calculator to shortlist pairings, then check benchmarks for your games before buying.